.svg)


El Niño Is Coming. Know Where to Look First.
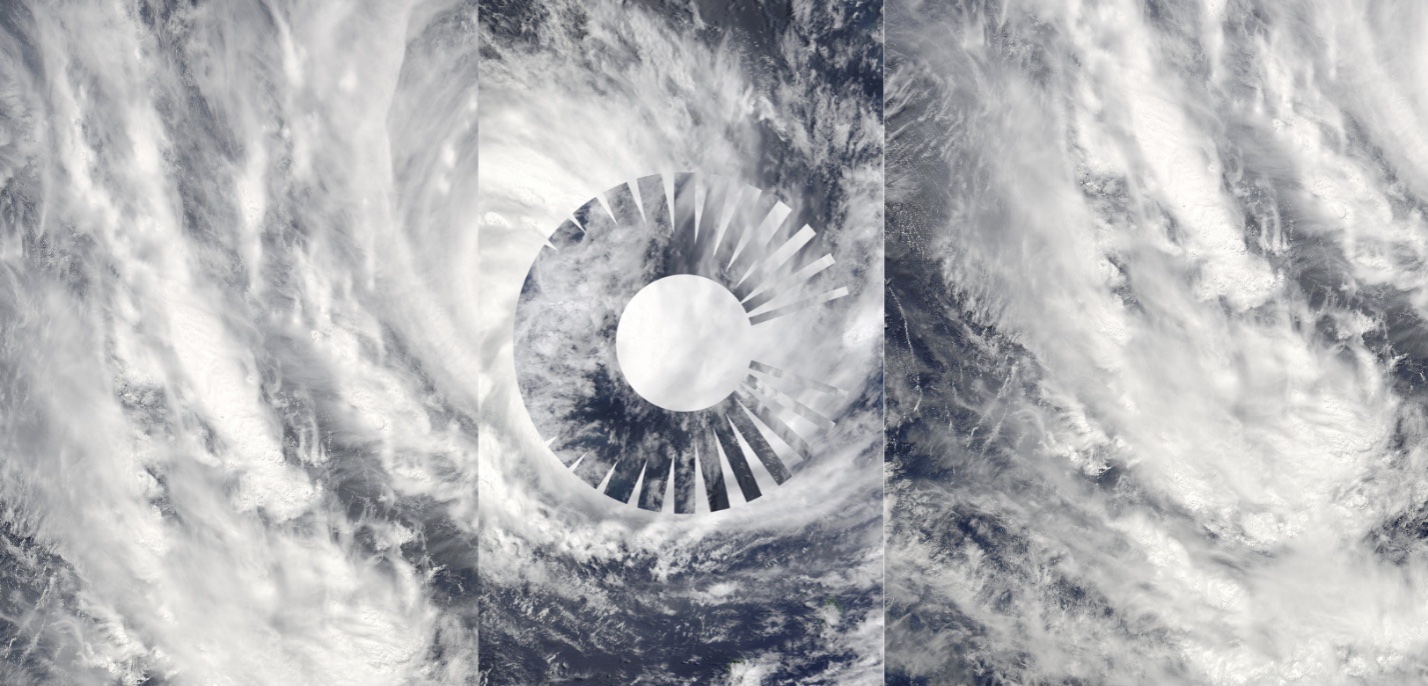
NOAA’s September 10 outlook gives it a greater than 90% chance of becoming very strong, with a 75% chance that its October–December strength exceeds previous El Niño events dating back to 1950. But even an event of that magnitude doesn’t determine exactly where extreme weather will occur or which infrastructure will be affected.
For infrastructure operators, that uncertainty is exactly the point. A seasonal forecast can tell you the odds are changing. It can’t tell you which slope will move, which crossing could scour, where access might be lost, or which assets will require attention first.
Those questions require local context.
There is good reason to pay attention to a seasonal signal like El Niño. Analysis of four decades of National Flood Insurance Program claims found that El Niño conditions were associated with more frequent and higher-magnitude insured flood losses across the Southwest and coastal Southern California. And individual events can be enormously costly. During the strong 1982–84 El Niño, the Thistle landslide in Utah severed two major highways and a transcontinental rail line, with the railroad alone spending about $40 million to re-establish its route.
From a seasonal forecast to infrastructure risk
Extreme weather rarely creates a single problem.
Heavy rainfall can raise rivers, accelerate erosion, raise water tables, trigger or accelerate landslides, destabilize fire-scarred terrain, and combine with snowmelt to amplify flooding.
During this year’s atmospheric river events in British Columbia and Washington, for example, teams were simultaneously evaluating streamflow, precipitation forecasts, imagery, inundation extents, landslide observations, and field information as conditions evolved.
The challenge wasn’t a lack of data. It was understanding what all of that information meant together. That same challenge applies when preparing for El Niño.
The useful question isn’t simply “Will it be wetter this winter?”
It’s “If extreme precipitation occurs, where could it matter most?”
Start with what you already know
Preparing for an extreme event doesn’t necessarily require building an entirely new monitoring program. Organizations already hold valuable information about their infrastructure: previous inspections, mapped hazards, engineering assessments, instrumentation, field observations, lidar, satellite data, and records of past events.
Not every team starts from the same place. Some hold years of inspection records, instrumentation, and possibly repeat lidar data from different dates. Others hold a road log, a maintenance history, and the institutional memory of which crossings gave trouble the last time it rained hard. Both are workable starting points. Where no asset inventory exists, public lidar and imagery can provide a starting point for screening terrain and identifying locations for further review. The point is to start from what is available rather than waiting for the perfect dataset.
As mentioned, public data adds another layer of context. Cambio curates weather, hydrological, earth observation, and hazard datasets alongside an organization’s own information, including:
- Precipitation, weather forecasts, and soil moisture to track developing conditions
- Snowpack and snowmelt data to understand additional water entering a watershed
- Stream gauges to show how rivers are responding
- Lidar for detailed terrain information and a baseline for detecting future change
- InSAR for identifying patterns of ground movement across large areas
- Wildfire layers to identify areas where recent burns may have changed runoff and debris-flow conditions
- Hurricane and cyclone information as tropical systems develop
No single one of these datasets answers the risk question. Their value comes from seeing them together, in the context of the infrastructure, assets, and hazards that matter.
In practice, that context can help narrow attention to a short list of plausible failure mechanisms: drainage structures where culverts and cross-drains may be undersized or obstructed; scour and channel avulsion around bridges, embankments, and other infrastructure; and acceleration of existing deep-seated landslides during prolonged wet conditions.
Know what's changing
Once an event begins, the question shifts from where could something happen? to what is changing now?
During the 2025/26 atmospheric rivers affecting British Columbia and Washington, Cambio was used to rapidly bring flood-related information into a shared environment, including streamflow alerts, precipitation, imagery, inundation extents, and landslide observations. That helped teams from multiple organizations maintain a common picture as conditions changed.
Importantly, monitoring isn’t about predicting exactly when or where a failure will happen. It’s about reducing surprise. An instrument threshold, rising stream gauge, intense precipitation forecast, changing slope velocity, or field observation can provide evidence that conditions are departing from what was expected.
Combined with site and asset context, that evidence helps teams focus attention, prioritize inspections, and decide when action is warranted.
When the storm passes, ask what changed
The end of the weather event isn't the end of the story. After Hurricane Helene, rapid lidar acquisition helped engineers assess a landscape where landslides, erosion, scour, and channel change had affected large areas and ground access was limited.
This is where good baseline information becomes especially valuable. Comparing pre- and post-event lidar can reveal changes that may be difficult to identify from a road, aerial photograph, or individual field inspection.
The same principle applies whether the trigger is a hurricane, atmospheric river, flood, wildfire followed by intense rainfall, or an El Niño winter.
What changed, where did it change, and does that change affect the assumptions we were making about the infrastructure?
Carry the lessons into the next event
Sometimes the most important outcome is not restoring what was there before, but changing how the infrastructure is understood and managed afterward.
Following the catastrophic 2022 rain-on-snow flood in Yellowstone National Park, engineers rebuilding the North Entrance Road had to work through terrain dominated by large landslides. Real-time ShapeArrays, piezometers, slope inclinometers, remote sensing, and other site information were brought together in Cambio as the design evolved.
Monitoring ultimately identified an active shear plane approximately 190 feet deep, information that influenced decisions about where construction could safely proceed. It’s a reminder that resilience isn’t simply getting through the next storm. It’s learning from each event and carrying that knowledge forward.
The time to build context is before the rain
We don’t know exactly how the 2026–27 El Niño will affect every region, watershed, or piece of infrastructure.
Seasonal forecasts tell us when the odds are changing. Earth science data helps us understand where those changing conditions could matter. Monitoring helps identify when conditions are actually changing. And preserving what happened before, during, and after an event helps organizations make better decisions the next time.
For many teams, the practical challenge is having more assets than resources to investigate or treat them all. That makes prioritization important before conditions deteriorate: understand where exposure is greatest across slopes, drainage crossings, engineered earth structures, and other vulnerable locations. Then, when precipitation arrives, teams know which assets warrant closer attention and what changing conditions should prompt a response.
The earlier that context is in place, the more useful it becomes when severe weather arrives. The goal isn’t to predict every failure. It’s to know where to look first.
.png)
.svg)

.png)