.svg)
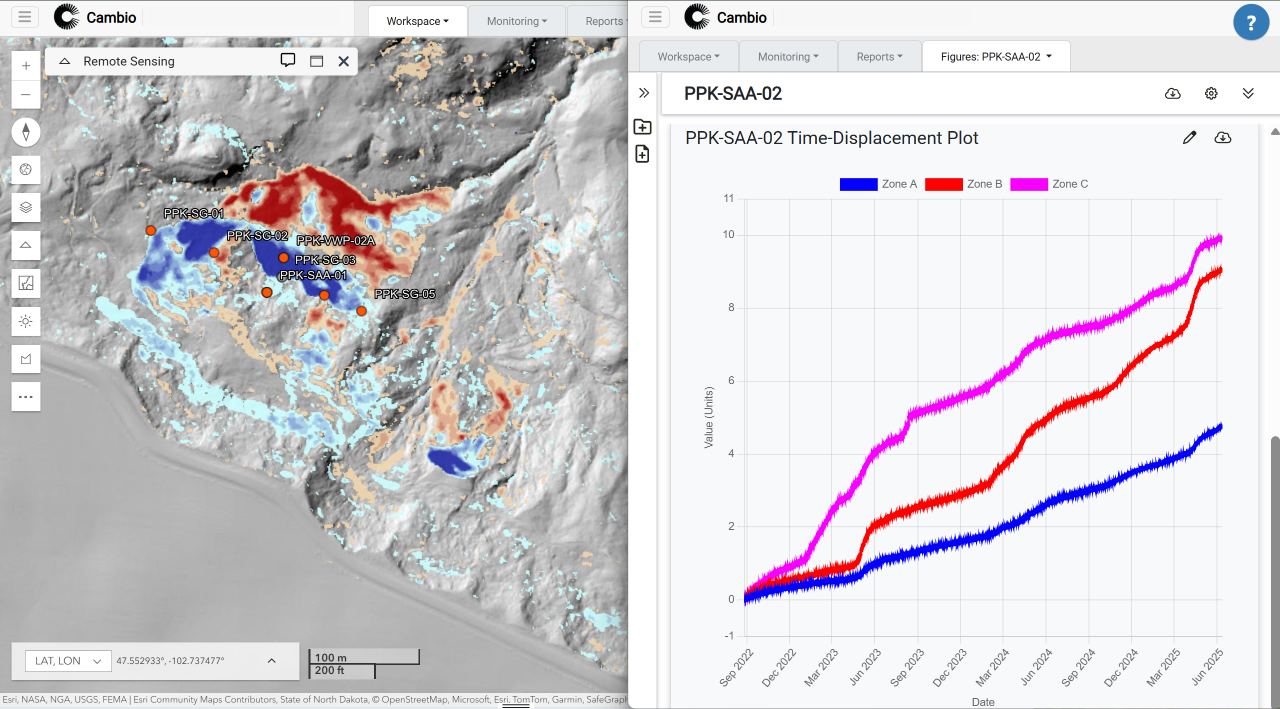
Detect subsurface signals and track trends in real time. Bring together telemetry from piezometers, SAAs, extensometers, and more—layered with historical data and site events to detect anomalies early.
- Geo-referenced, site-linked instrument feeds
- Unified time-series plots with event and data overlays
- Configurable alerts for thresholds and rate-of-change
- Shared annotations and interactive plotting tools
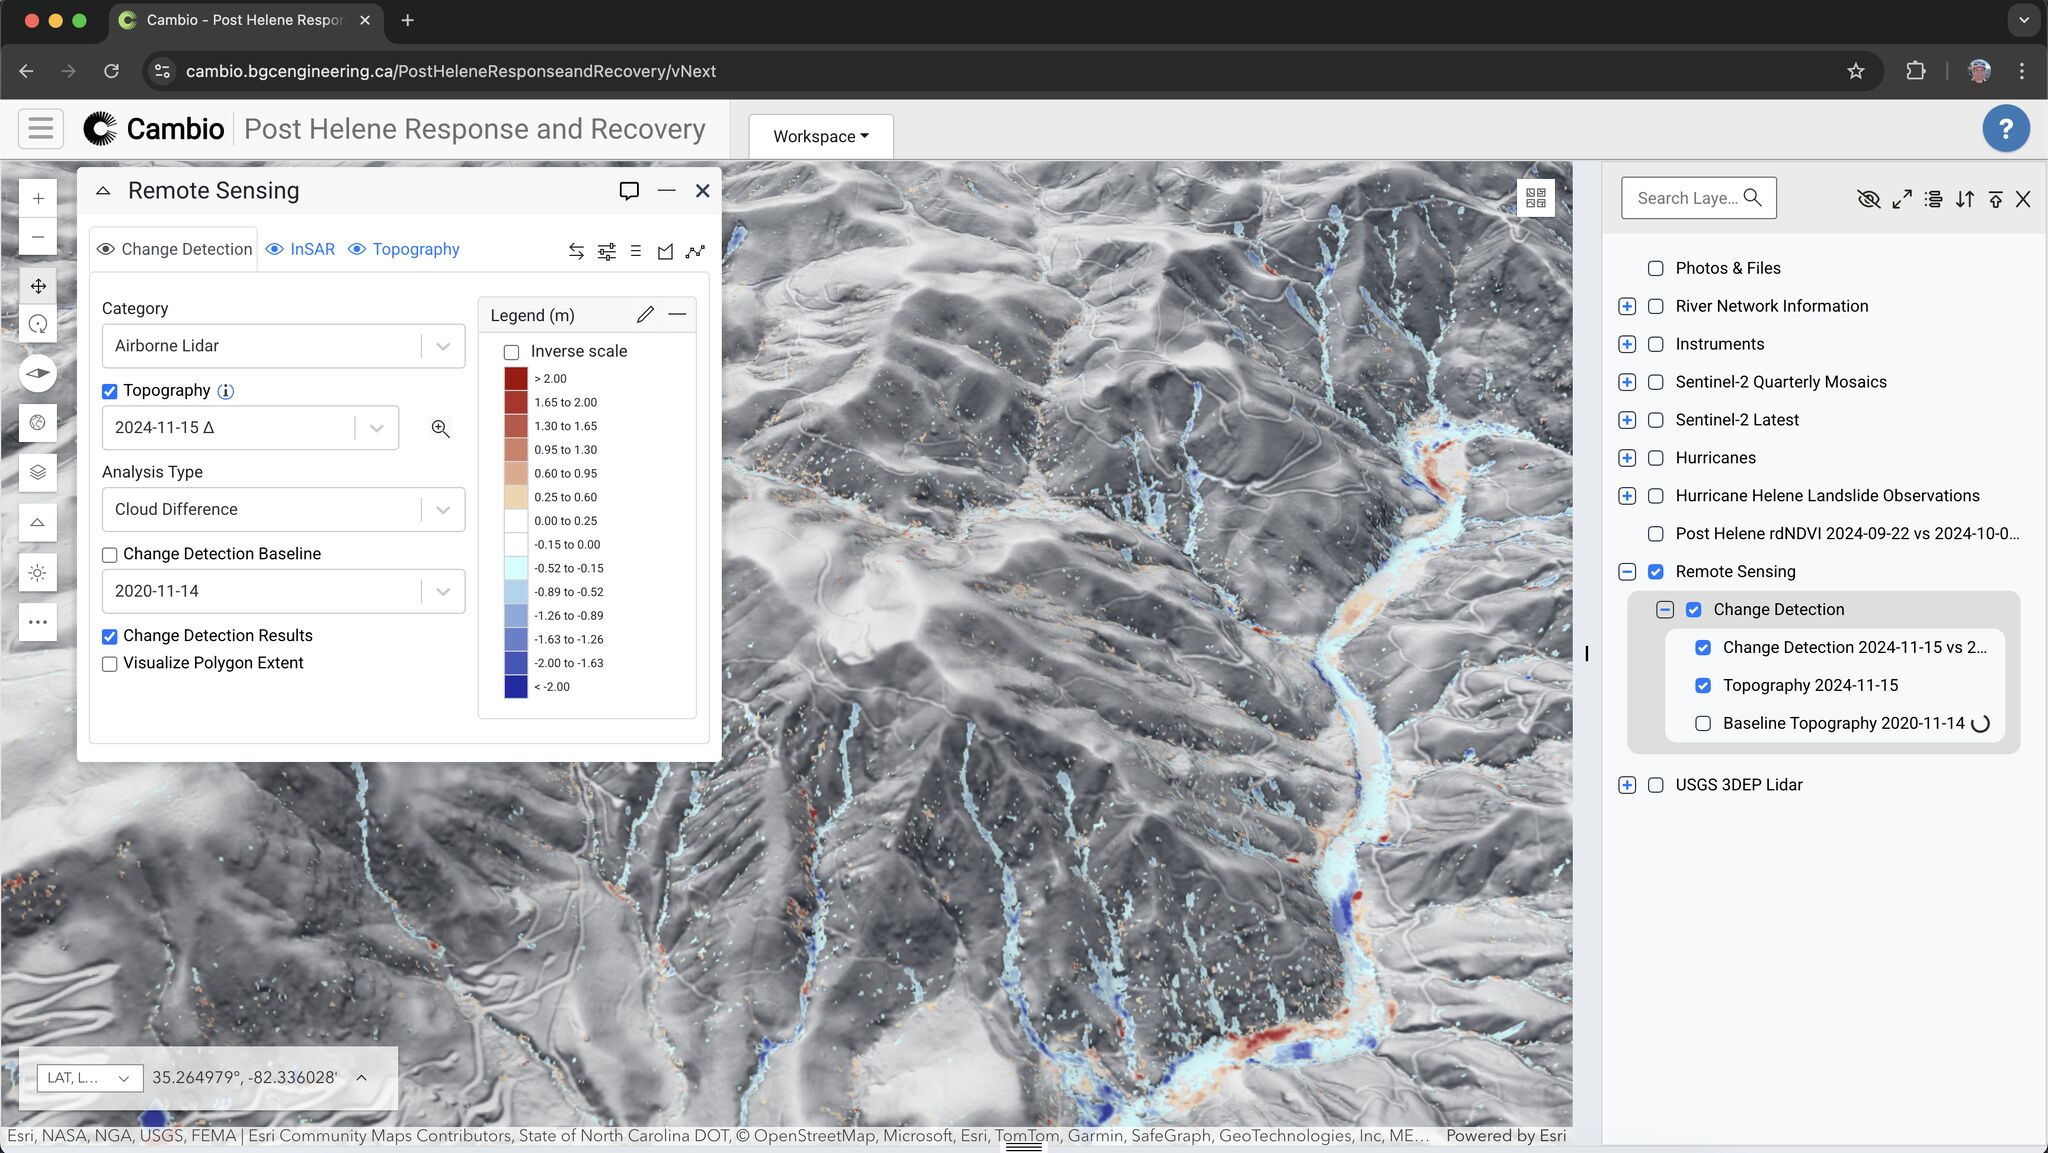
Know what’s moving across sites, large corridors, and complex terrain. Integrate high-res lidar, InSAR, and optical imagery into monitoring programs to make surface change easier to detect, interpret, and act on.
- Multi-temporal lidar to detect ground surface changes
- Satellite InSAR to track ground deformation over time
- Optical imagery overlays for visual inspection
- 3D terrain tools to view topography from any angle
- Cross-layer analysis with instruments, boreholes, and weather
Get boots-on-the-ground insight into monitoring and surveillance programs to transform mobile observations into actionable context while enabling field crews to carry the latest data in their pocket.
- Geotagged photos, notes, and docs anchored to map zones
- Mobile tools for offline capture and online sync
- Searchable table, gallery, and map views across time and space
- In-field access to prior observations, readings, and map layers (including lidar)
Analyze live and historical rainfall, snowpack, and natural hazard data to assess severity and impact of floods, quakes, and extreme events together with other site information.
- Visualize MRMS, HRRR, SNODAS, HCaPA, RDPS, ShakeCast, and ERA-5 raster data
- Run rainfall analysis with built in IDF curves
- Track seasonal risk indicators and snowpack anomalies
- Monitor quakes, wildfires, and storms in real time
.png)

.png)