.svg)
Instrumentation in Cambio™: See What Is Really Happening On Site
Getting reliable instrumentation data isn’t always easy.
For some organizations, it means wrangling legacy systems, manual downloads, aging loggers and sensors, or third‑party data streams just to assemble a usable dataset.
But even when the data is flowing, that’s rarely where the challenge ends.
The real work is separating signal from noise—confidently, consistently, and in context.
Most operating assets and geohazards don’t suffer from a lack of data. They suffer from fragmented understanding. Readings live in spreadsheets. Logger files sit on shared drives. Plots are rebuilt (again) for every report. And the broader site context—weather, construction stages, changing loads—lives somewhere else entirely.
That separation makes interpretation harder than it needs to be.
Cambio’s instrumentation tools were built to solve that problem for infrastructure organizations and their geotechnical teams: not just by managing data, but by putting instrumentation back into the physical, operational, and risk context of the asset itself.
Instrumentation Is Only Useful When It Can Be Operationalized
Every reading is influenced by something:
- Rainfall and groundwater response
- Seasonal temperature changes
- Construction sequencing and loading
- Reservoir levels or pond elevations
- Ongoing surface or subsurface movement
Yet instrumentation data is often reviewed as a standalone time-series, forcing teams to mentally connect the dots across multiple systems—often under time pressure.
In Cambio, instrumentation data sits alongside the rest of your site information, including complementary monitoring and spatial datasets:
- Geospatial data, including lidar, InSAR, optical imagery, and terrain models
- Inspections, field notes, and site photos
- Boreholes, designs, as-builts, and construction stages
- Weather data and notable events
- Alarm thresholds and project criteria
Instead of asking “Why did this instrument move?”, organizations can answer “What was happening on site—and does this impact safety, performance, or compliance?”
That shift—from isolated readings to integrated understanding—is where interpretation improves.
Let’s Start With Centralized, Instrument-Agnostic Data
Cambio provides a single, centralized source for instrumentation records, readings, and plots. Manual, automated, and third-party data can all be brought into the same platform, reducing time spent reconciling spreadsheets, exports, and file versions.
The system is instrument-agnostic, supporting common geotechnical and environmental datasets such as SAAs, slope inclinometers, VWPs, GPS, climate stations, and strain gauges—without locking teams into a closed workflow.
Add Visualization That Supports Operational Decisions
Cambio’s visualization tools are designed for how engineers actually interpret behavior:
- Plot alarm thresholds directly on time-series data
- Overlay pond levels, construction stages, or other site elevations
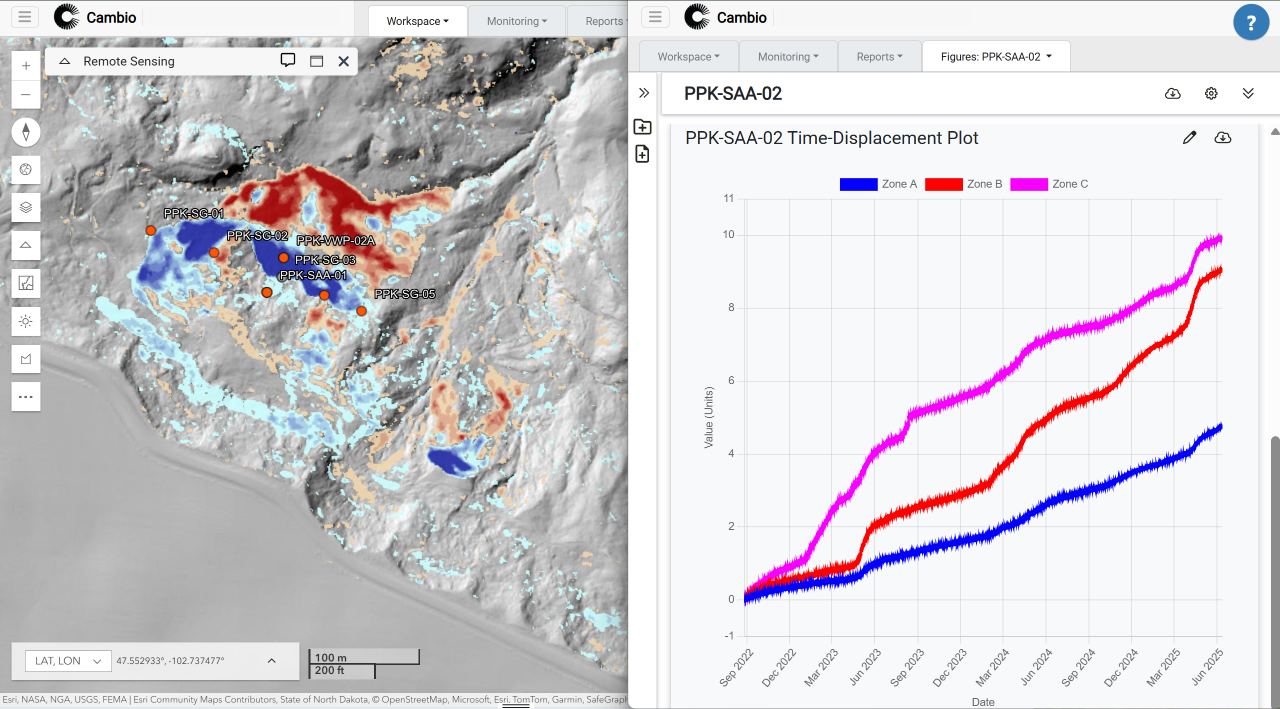
- Visualize complex movement datasets (like SAA or GPS) in the same figure and spatially together
- Compare subsurface response with surface or remote-sensing data, including lidar, InSAR, and optical imagery
Threshold exceedances and data gaps are tracked automatically, making it easier to:
- Confirm whether design criteria were met
- Review instrument performance over the reporting period
- Focus time on interpretation instead of log-checking
Together, these tools help geotechnical teams distinguish early warning signals from normal variability, validate performance, and understand whether observed behaviour aligns with expectations—without exporting data into multiple plotting tools.
To Get Consistent, Defensible Reporting
For organizations responsible for critical infrastructure, reporting isn’t just about presentation—it’s about defensibility.
In Cambio, full figures—or individual panels—can be duplicated to standardize layouts across appendices. Repeatable formatting reduces reviewer back-and-forth and helps produce cleaner, more professional figures with less manual effort.
What This Means For Infrastructure Organizations
- Operations and Monitoring Teams
Bring together manual and automated instrumentation data from across the asset. Reduce time spent chasing files and focus instead on understanding whether the site is behaving as expected. - Asset Integrity, Geotechnical, and Environmental Teams
Work with contextualized plots that support interpretation, risk assessment, and clear communication with internal stakeholders and external reviewers. - Asset Owners and Decision-Makers
See the latest instrumentation data in context—what changed, what triggered it, and whether it matters—without waiting for a report cycle.
Why Context Matters More Than Ever
A few millimetres of movement can mean very different things depending on whether:
- A reservoir was filling
- Temperatures dropped sharply
- A haul road was widened
- A major storm passed through
- Construction entered a new stage
Instrumentation becomes most valuable when it’s interpreted as evidence within a broader geological and operational narrative.
That’s how organizations make better decisions, maintain safer infrastructure, and respond more effectively to changing conditions—especially as climate extremes become less predictable.
Ready to Bring Your Instrumentation Into Context?
If you’d like help bringing your instrumentation data into Cambio—or want to understand how other organizations are using it to support asset integrity and resilience—our team can help you get started.
Earth science is complex enough—and the stakes are high. Your instrumentation workflows don’t have to be.
.jpg)
.jpg)
.png)
.png)