.svg)
Building Continuous Insight in Tailings Management with a Geo-Referenced Digital Twin
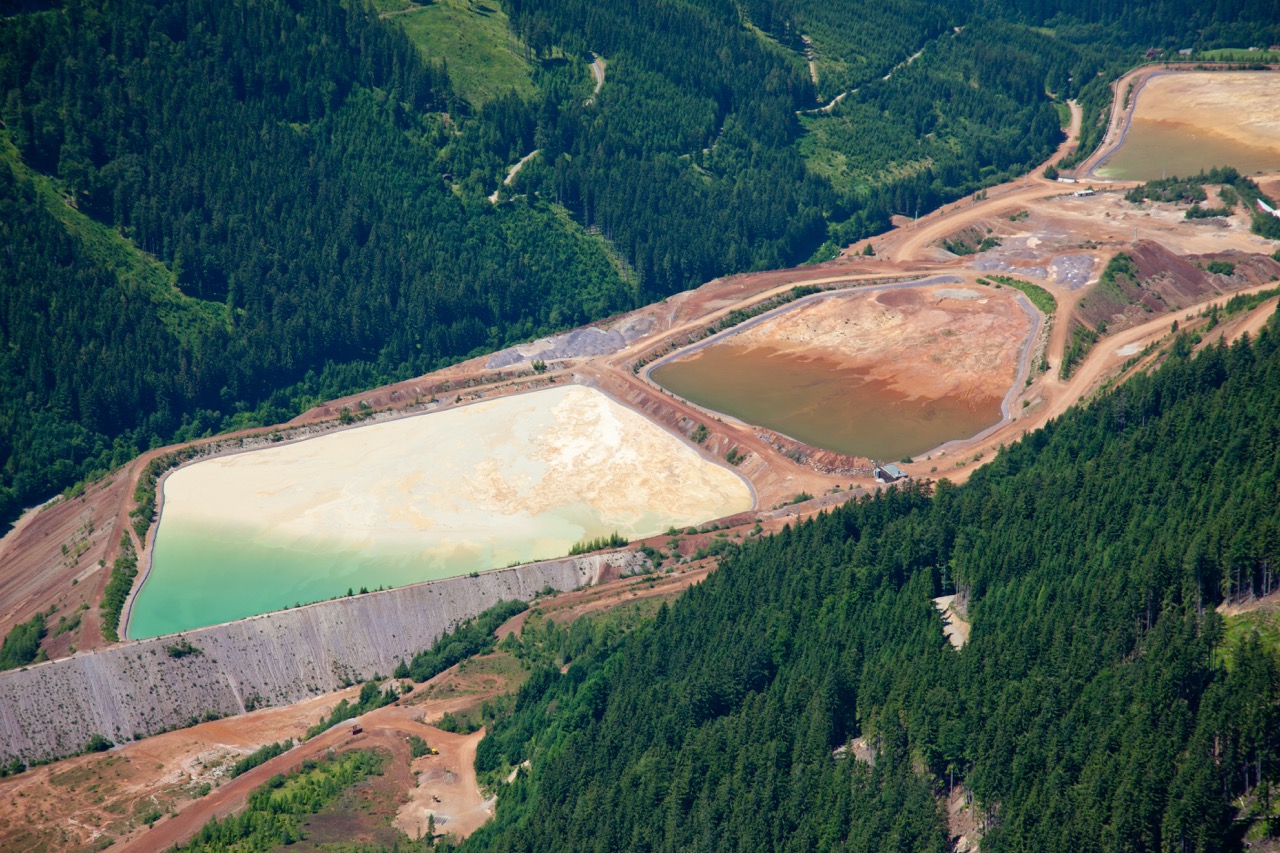
The Problem: Siloed Data, Manual Processing, and Slow Response Times
Tailings storage facilities (TSFs) are high-risk components of mining operations, yet traditional monitoring approaches often leave teams with blind spots. Data from instruments, inspections and photos, and remote sensing frequently live in separate platforms—underutilized, difficult to access, or inaccessible altogether. Common challenges include disconnected systems, time-consuming manual processing, and limited real-time visibility—all of which slow down response times, hinder communication, and impede proactive risk management.
For example, if elevated pore pressure goes unnoticed in a disconnected workflow, an early warning could be missed. With increasing regulatory scrutiny and stakeholder expectations, periodic inspections and static reports are no longer enough.
At the recent Eastern Australian Ground Control Group (EAGCG) Workshop in Sydney, Katie Burkell from Cambio Earth, presented a real-world example of how a TSF project has been using Cambio for ground control monitoring to address these challenges. The project team had been manually stitching data together from multiple sources—a very time-consuming process that has the potential to miss critical correlations. These processes made it harder for everyone—from field technicians to executives—to operate from the same understanding of site conditions.
You wouldn’t build a dam without a design—why manage one without a digital knowledge base?
Building a Digital Knowledge Base with Real-Time Surveillance and Integration
Fortunately, digital transformation is gaining traction in tailings management. Forward-looking operators are moving beyond spreadsheets and isolated software platforms, adopting integrated monitoring systems that deliver a near-real-time view of site conditions.
Rather than manually compiling data from disparate sources for reporting or analysis, engineers can now use platforms that combine sensor data, field inputs, imagery, topography, and design files—alongside trigger action response plans (TARPs)—all accessible from the office or the field. This unified view breaks down communication barriers between teams and enables continuous surveillance of TSF conditions. Data is no longer trapped on individual laptops or buried in filing cabinets—it’s centralized, structured, and continuously updated.
At the core of this transformation is the concept of an integrated geospatial knowledge base. This is more than a static GIS map or data viewer—it’s a dynamic, visual record of everything from instrument readings and aerial imagery to design records and inspection notes.
Katie emphasizes that bringing fragmented data into a single, geospatial system transforms a pile of disconnected inputs into a powerful decision-making tool. It allows teams to view and monitor data in context—seeing how one variable impacts another over space and time.
For example, users can overlay piezometric readings on a recent drone orthophoto or elevation surface to evaluate whether changes in pore pressure align with rainfall events or active construction areas. With all data tied to geospatial coordinates and time, engineers can compare current conditions to historical baselines and design expectations. This kind of integration supports not only root-cause analysis, but also construction progress tracking against yearly campaign—leading to data-driven reporting and more effective progress/compliance tracking.
Collaboration Through Shared Data
An integrated geospatial knowledge base also supports collaboration and transparency. When owners, EoRs, and site teams are accessing the same real-time and historical data, everyone is working from the same map—literally.
Field crews log inspections and observations using a mobile app that syncs directly to the platform, eliminating transcription errors and delays. Meanwhile, anyone on the team can receive automatic alerts when instrumentation thresholds are exceeded, ensuring an emerging issue triggers immediate action and doesn’t go unnoticed for days. This on-demand access to data means teams can respond faster and with greater confidence.
As Katie noted at EAGCG, digital monitoring means you can visualize “site conditions anytime, anywhere.” And for those not physically on-site, having that shared access builds trust, keeps communication flowing, and ensures decisions are grounded in data—not just assumptions.
A “Digital Twin” for Tailings Data
Over time, this integrated knowledge base becomes a dynamic digital construction record—a virtual replica of the TSF that consolidates critical information and continuously reflects current conditions.
The ‘digital twin’, as we like to call it, gives operators a living model of the site. You can quickly pinpoint where action is needed and which variables are deviating from expected behavior. Instead of digging through folders of spreadsheets and image files, the EoR or operator can open a shared workspace and immediately visualize construction progress, review instrumentation, or investigate alerts—all in one place.
As Katie emphasized at EAGCG, this becomes the “boots-on-the-ground view” for those who aren’t on-site, letting them virtually inspect dam conditions as if they were walking the alignment in person.
Interactive Workspaces, Not Just Static Maps
These geospatial workspaces aren’t just maps—they’re collaborative, interactive, analytical tools.
- Engineers can toggle data layers on and off
- Compare conditions across different periods
- Switch to 3D views or draw cross-sections through the dam to inspect subsurface details
In a single cross-section, you can evaluate piezometer readings relative to geological layers and design features—instantly seeing whether an instrument is located in a permeable foundation zone or near the influence of the tailings pond.
Workspaces also automate many tedious tasks:
- Plotting time-series graphs
- Calculating trends
- Viewing triggered alarms when thresholds are crossed
So when an anomaly arises, you’re not just seeing a red flag in a table or plot; you’re seeing where it is on the dam, what material it’s in, and what has changed around it recently—directly linking sensor behavior to changes in site imagery or weather events.
Why dig for data when it can surface itself—in a matter of minutes?
A New Way to Investigate and Act
Imagine this: a piezometer near the embankment crest starts trending upward unexpectedly. Instead of waiting for someone to flag it in a spreadsheet days later, the team gets an alert immediately.
They pull up recent rainfall records, examine drone orthophotos, and overlay borehole logs—all in the workspace. The piezometer is in a sandier zone, and the area saw 100mm of rain last week. It’s likely a localized pressure response—not structural movement. Instead of speculation, the team has multiple lines of evidence supporting their conclusion—and can make decisions confidently, in the moment.
Because decisions shouldn’t be as slow as consolidation.
In Summary
As Katie likes to say, “An integrated geospatial knowledge base is more than just good data management—it’s a living digital twin of the facility.” By eliminating silos, enabling geospatial context, and improving real-time collaboration, operators and engineers can detect issues earlier, respond faster, and manage the performance of TSFs more safely and effectively.
Read Part 2 of our blog series here.
.jpg)
.jpg)
.png)
.png)